The Market's Language — Learn to read the battlefield
Prerequisites: Modules 1–2. Work through Sections 1–4 in order. Each concept builds directly on the previous one. Tap the cards in Section 1 for detailed diagrams. Complete the practice tasks before moving to Section 2 — you'll need them.
Think about the last time you watched a tug-of-war match. One team pulls. The other resists. The rope moves toward whoever applies more force. A price chart works the same way — buyers pull price up, sellers pull it down, and every single candle shows you who won that round.
Before this module you selected a market and set up your charting tool. Now you need to learn the language charts speak. That language is made of candles, structural levels, and the three states price can be in at any moment.
Everything that comes after this module — reversals, entries, risk management, confluences — starts here. These are the building blocks. Get them right and the rest of the course follows logically.
Framing statement:
A candle's close — not its wick — is the verdict. A structural level is only broken when a candle closes beyond it. That one rule governs every decision in this module and every module after it.
01
Section 1
Reading Candles
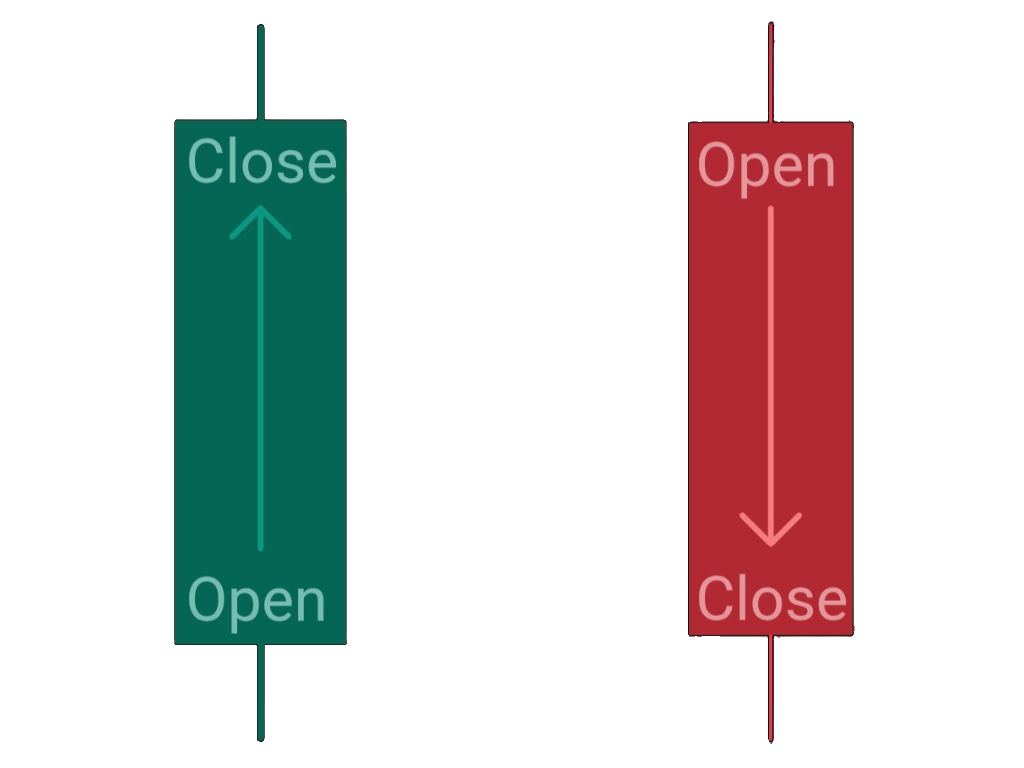
Candles are price action read in blocks of time called timeframes. Here's the thing: every candle tells you exactly who won that time period — buyers or sellers. It's that simple.
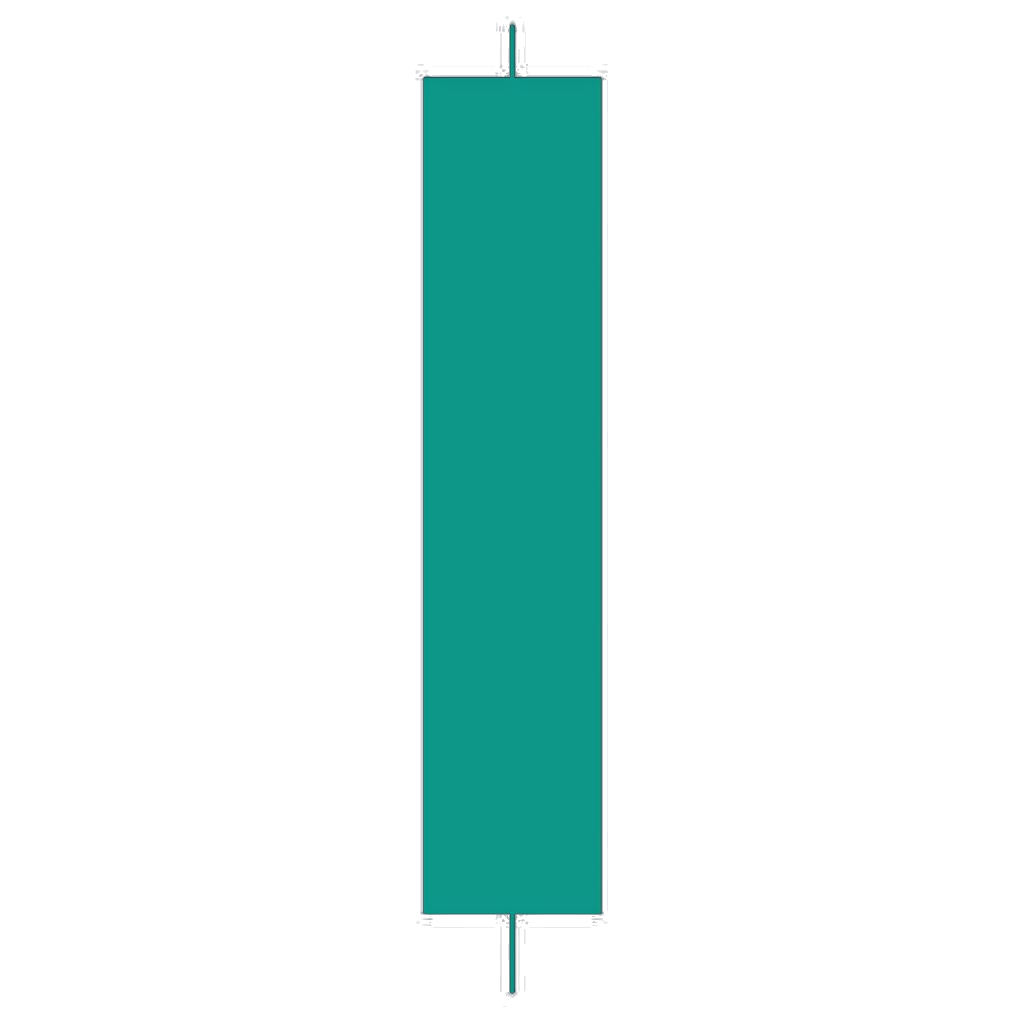
Body (Open & Close) Tap to learn more
The Open is the first trade of the timeframe. The Close is the last — and here's what matters: it tells you who actually won the battle. Green candle = buyers won. Red candle = sellers won.
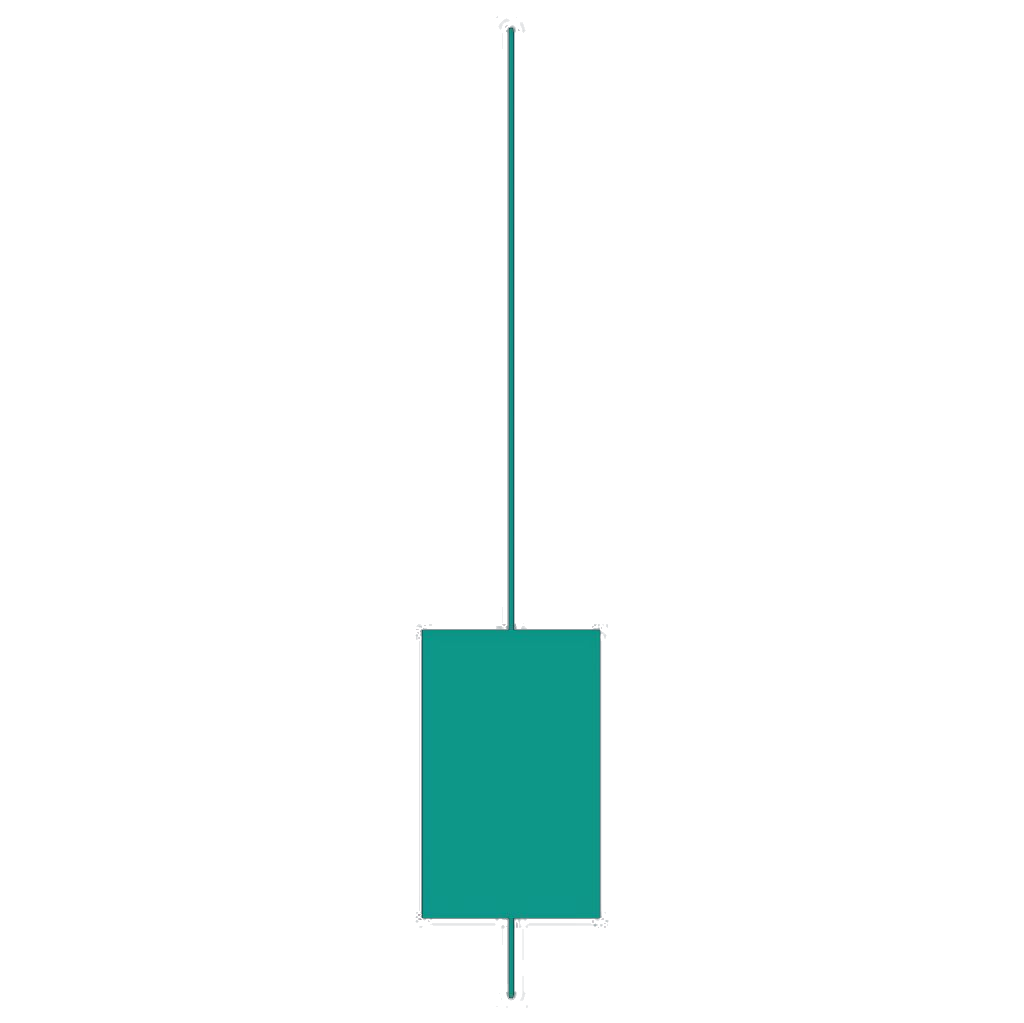
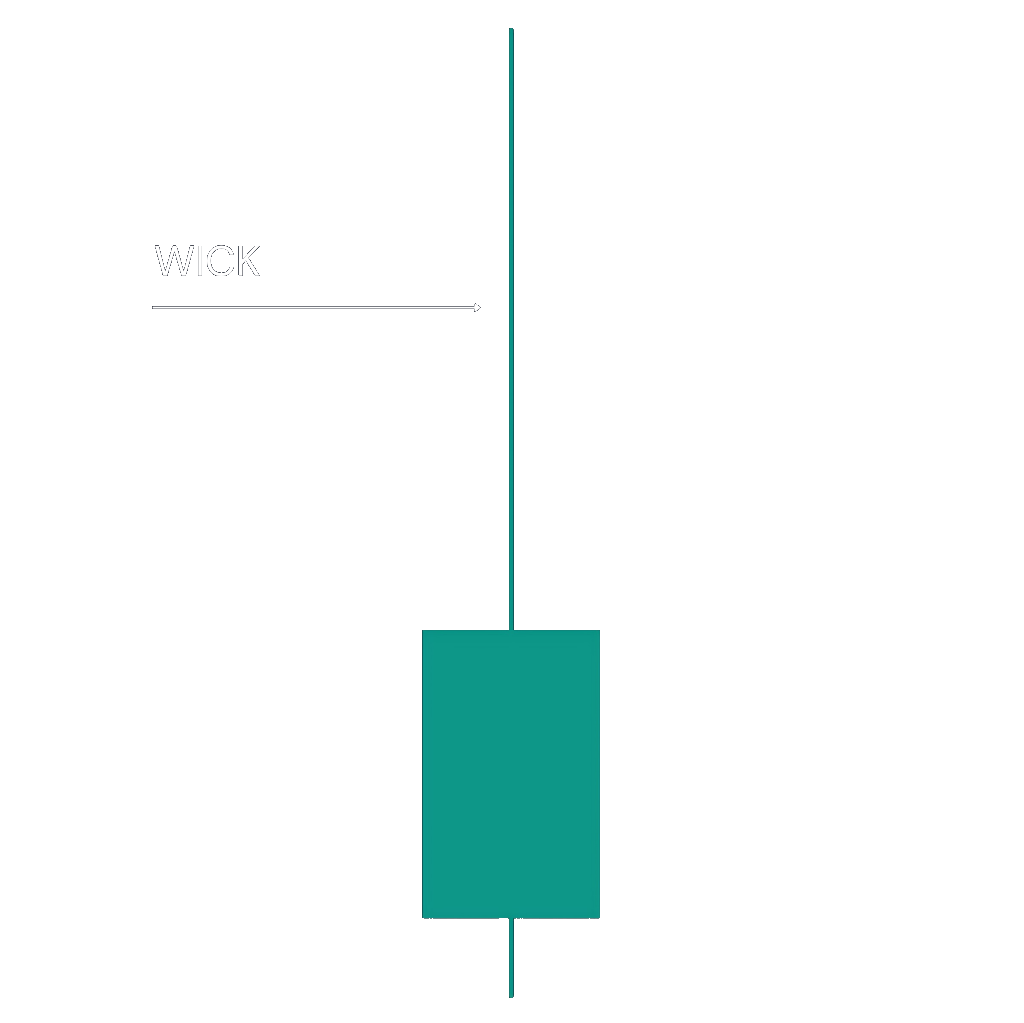
Wick — Seller Rejection Tap to learn more
The highest point price reached during that candle. Buyers pushed up — sellers said "no" and pushed back down. Long wick = sellers rejected hard. But the wick alone means nothing. The close is what counts.
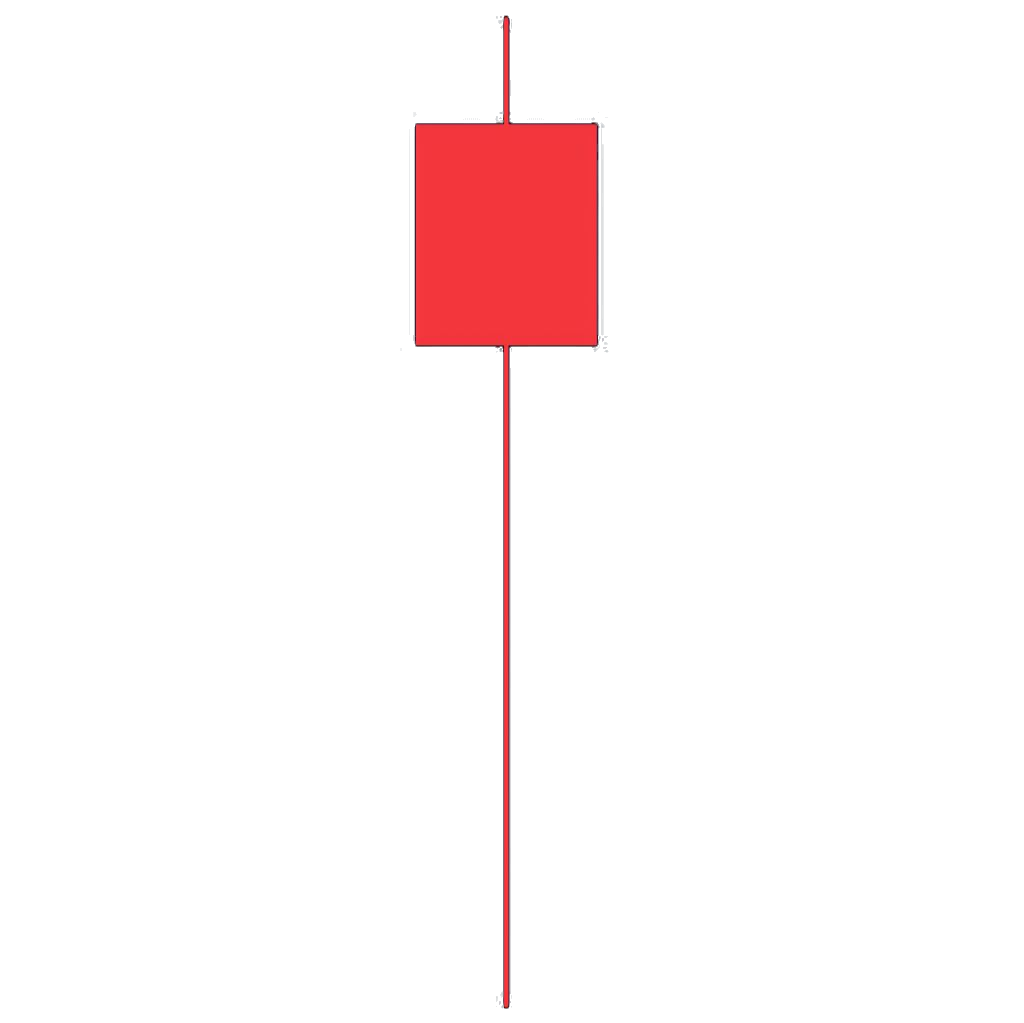
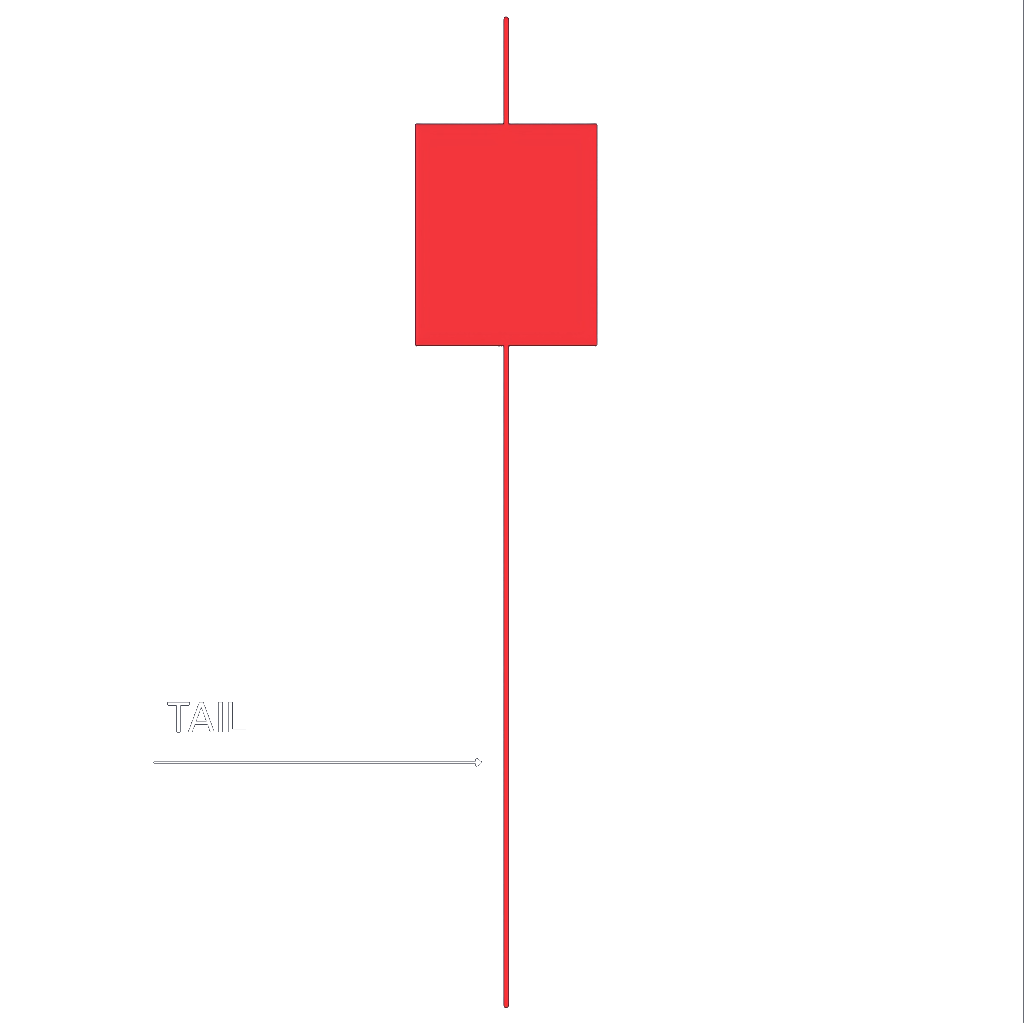
Tail — Buyer Rejection Tap to learn more
The lowest point price reached during that candle. Sellers pushed down — buyers said "enough" and pushed back up. Long tail = buyers fought hard. But again: the close tells the real story.
Candle Anatomy
Body — Open & Close
Open (O) The first trade of that timeframe. On the Daily, it's where the day started. On the 1H, where that hour began.
Close (C) The last trade of that timeframe — and here's what matters: the close tells you who actually won the battle. If price closes above where it opened, buyers won that period. Green candle. If price closes below where it opened, sellers won. Red candle.
Think about it this way: two armies clash. The close is where the line is drawn when the dust settles. That's your answer.
A wick beyond a structural level means nothing. A close beyond it means everything. Always read the close — not the wick.
Candle Anatomy
Wick — Seller Rejection
Wick / High (H) The highest point price reached during that candle's timeframe.
Here's what's really happening: buyers pushed price up. They tried to take ground. But sellers said "no." They pushed back down. Price retreated. That high-water mark? That's the wick. A long wick means sellers rejected the buyers hard. Price shot up, then crashed back down.
But here's the secret most traders miss: that wick doesn't mean anything yet. It's just a test. What matters is where price closed. Did buyers hold the line at the close, or did sellers force them to retreat? The close answers that. Wicks are noise. Closes are truth.
Candle Anatomy
Tail — Buyer Rejection
Tail / Low (L) The lowest point price reached during that candle's timeframe.
Same thing, opposite direction. Sellers pushed price down. Buyers pushed back up. That low? That's the tail. A long tail means buyers fought hard to stop the selling. Price dropped, then recovered.
Again: the tail doesn't confirm anything. The close does. Did sellers hold the line lower, or did buyers force price back up? Close tells you. Tail is just the attempted attack.
💡 Coach moment: You're learning to read institutional footprints right now. When you see a long wick or tail, you're seeing institutions test a level. When you see where price closed, you're seeing what institutions actually committed to. That difference is everything.
Summary
Every candle has three parts: Body (Open → Close, who really won), Wick (highest point, seller test), Tail (lowest point, buyer test). The close is what counts. Wicks and tails are probes. Closes are commitments.
Master this, and you stop guessing what price is doing. You start reading it.
Practice Assignment
Read 10 Candles
Open a chart. Pick any candle. Ask yourself: Did buyers win (close above open) or did sellers win (close below open)? Now look at the wick and tail. Did price test higher or lower than the close? Do this 10 times. Speed matters. You're building the muscle memory to glance at a candle and instantly know: who won, and what tests happened.
02
Section 2
Structural Levels
The structure of a market is defined by its high and its low. Think of them as walls — the ceiling and the floor. Every market trades within these boundaries. Now here's where it gets important: these walls aren't random. They're where institutions made their stand. They pushed hard there. They stopped. That level matters because institutions remember it. They'll return to it.
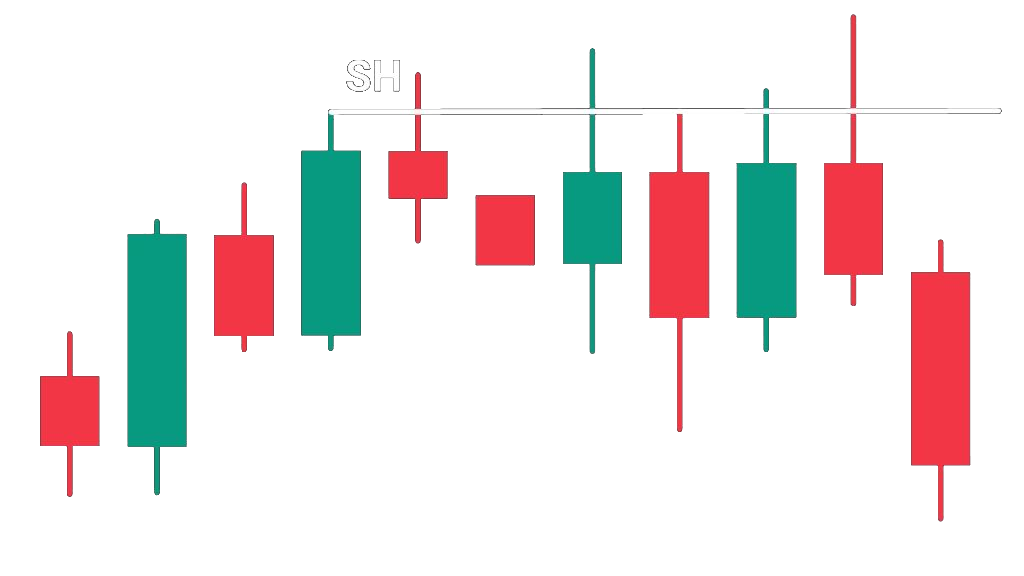
Structural High (SH)
The high of the last candle pushing upward before it stopped. Buyers pushed. They reached their peak. Then sellers pushed back. That peak? That's the SH. It marks exactly where buyers ran out of ammunition. Next time price approaches — sellers will be waiting.
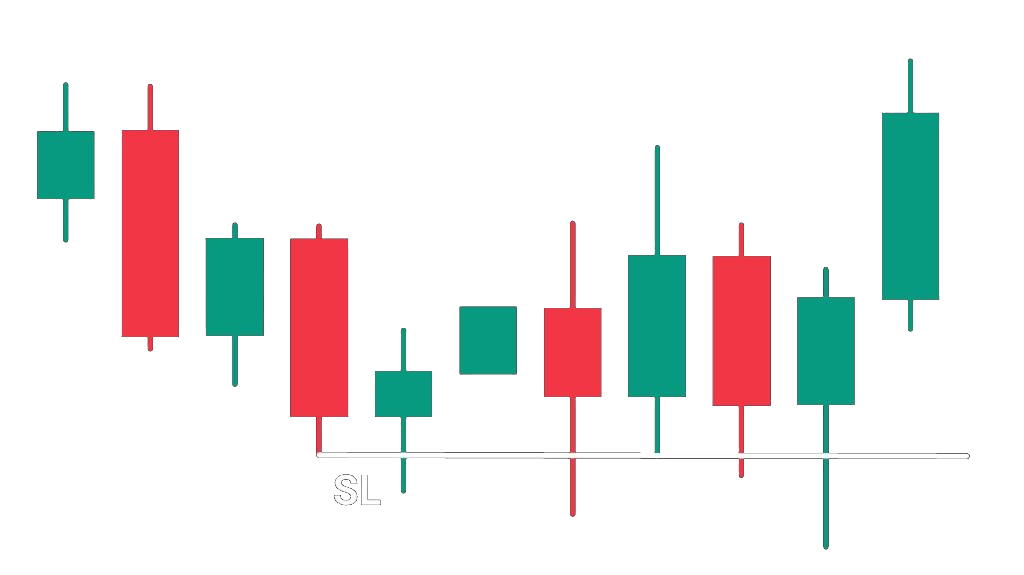
Structural Low (SL)
The low of the last candle pushing downward before it stopped. Sellers pushed. They reached their bottom. Then buyers pushed back. That bottom? That's the SL. Buyers defended there. They said "enough." Next time price drops to that level — buyers might do it again.
💡 Friend moment: This is cool — you're not just looking at random price levels anymore. You're marking where institutions fought hardest. Those fights leave marks. And those marks repeat. That's your edge right there.
Critical Rule — Wicks Don't Move Levels
Wicks don't move levels If price wicks beyond a structural level but closes inside it, that level didn't break. It held. Professionals don't chase wicks. Institutions don't either. Stay disciplined — the level stands.
Example
Price wicks to $105. Structural High is $102. But price closes at $103. The level at $102 is still standing — the wick was a test, not a break. Professionals traded $102. Retail chased $105 and lost money. You now know which side you're on.
Why This Matters. Structural levels are where big money positioned. When price returns to these zones, reactions are violent — because that's where institutional conviction shows up. You're not guessing where price might turn. You're marking where institutions have proven they care. These levels hold because buyers and sellers remember them. They return to defend or attack the same prices, again and again.
Summary
Structural levels = where institutions pushed and stopped. Wicks beyond them are tests, not breaks. Only closes matter. Discipline wins.
Practice Assignment
Mark 3 SH & 3 SL
On a chart, find 3 structural highs and 3 structural lows. For each, answer: Did price wick beyond it? Yes or no. Did price close beyond it? Yes or no. Only closes move the level. Screenshot and label everything. You're training your eye to see institutional memory.
03
Section 3
Break of Structure (BOS)
Now we ask the question: What happens when price finally closes beyond a structural level? That's called a Break of Structure (BOS). And here's why it matters: it means the market just changed hands.
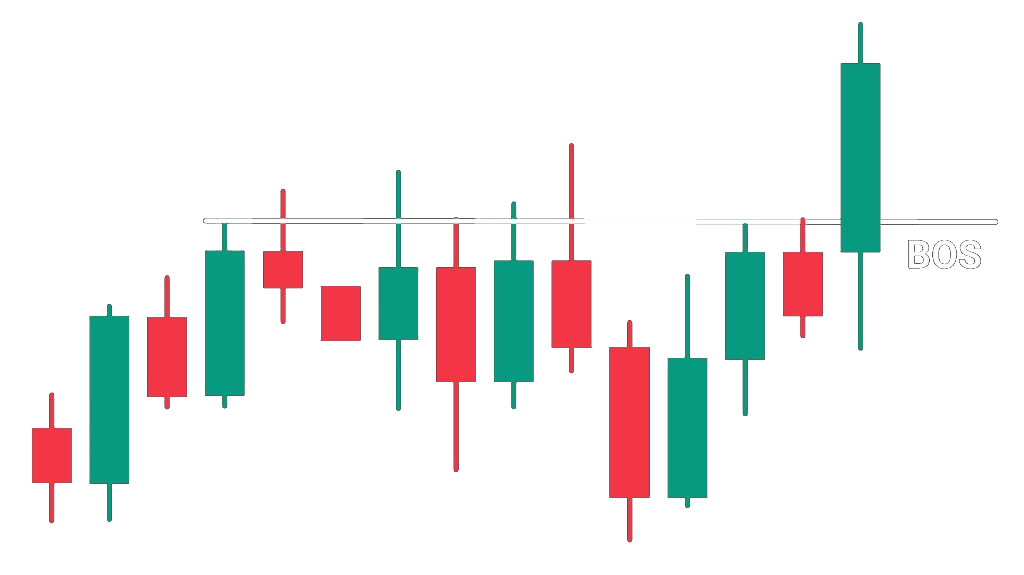
Bullish BOS
Price closes above a Structural High. What actually happened: buyers pushed, sellers pushed back, buyers pushed harder. Price closed above the ceiling. Sellers got overwhelmed. This candle left a footprint. It proved buyers have conviction.
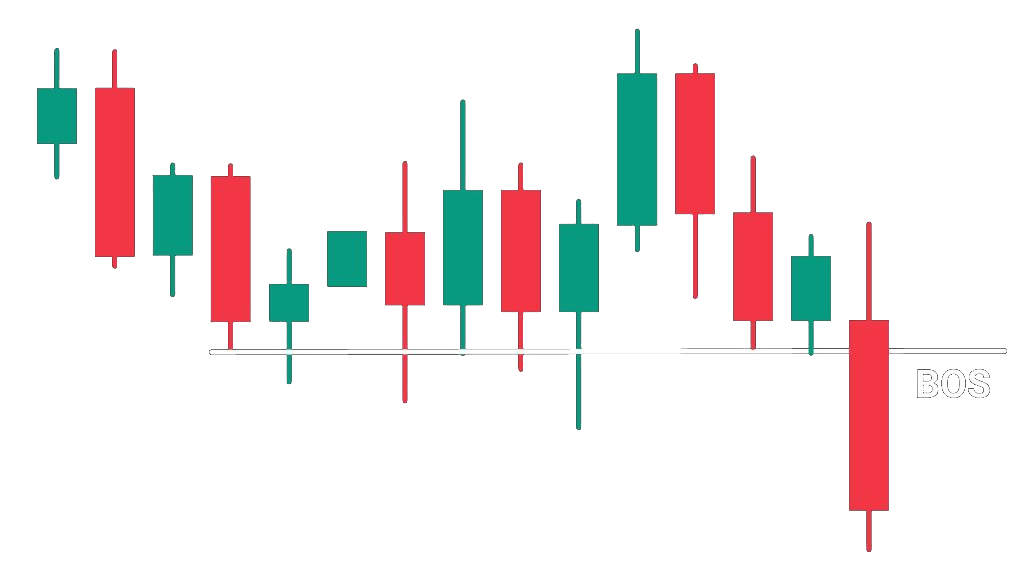
Bearish BOS
Price closes below a Structural Low. Here's the sequence: sellers attacked, buyers defended, sellers attacked harder. Price closed below the floor. Buyers got overwhelmed. Another footprint. Sellers broke through buyer defense.
💡 Friend moment: You just learned to see what professionals see on a chart. BOS candles aren't just random moves. They're proof of institutional commitment. When you mark them, you're marking exactly where the big money decided to take action. That's powerful.
Critical Rule — Wicks ≠ BOS
Wicks ≠ BOS If price wicks beyond a structural level but closes inside it, that is NOT a BOS on that timeframe. It's a test. Nothing more. Lower timeframes may show a BOS, but major structure is king. Respect the higher timeframe. One timeframe at a time.
Why This Matters. A BOS signals institutional control shifted. When you see a Bullish BOS, buyers just proved they're strong enough to break through seller defense. When you see a Bearish BOS, sellers just proved they're strong enough to break through buyer defense. The market just changed hands. This is your signal. Entries happen near here.
Summary
BOS = institutional control shifted. Bullish BOS = buyers proved their strength. Bearish BOS = sellers proved their strength. Major timeframe BOS trumps lower timeframe tests. One timeframe at a time.
Practice Assignment
Find & Label Every BOS
On the same chart from Section 2, locate where BOS occurred. Mark the structural level that broke and the candle that broke it. Label: Bullish BOS or Bearish BOS? Then ask yourself: What does this BOS tell me about who's in control? Write one sentence. Your answer shows you're reading the market like a professional.
04
Section 4
Market Structure Types & The Two Phases
Price moves in three directions over time: up, down, and sideways. Your job is simple: know which one you're looking at. Because trading with the market beats fighting it every single time.
Critical Rule — Two Phases in Every Structure
Here's something most traders never understand: every trend has a rhythm. And that rhythm has two parts.
Push PhasePrice moves away from a structural level with force. Buyers are committed (bullish) or sellers are committed (bearish). This is where BOS happens. This is where the market makes its statement.
Pullback PhasePrice comes back toward that level to test it. This is where professionals enter. Retail traders panic and exit. Professionals step in knowing the level matters — because they marked it weeks ago.
Understand these two phases. This is the difference between trading like a pro and gambling.
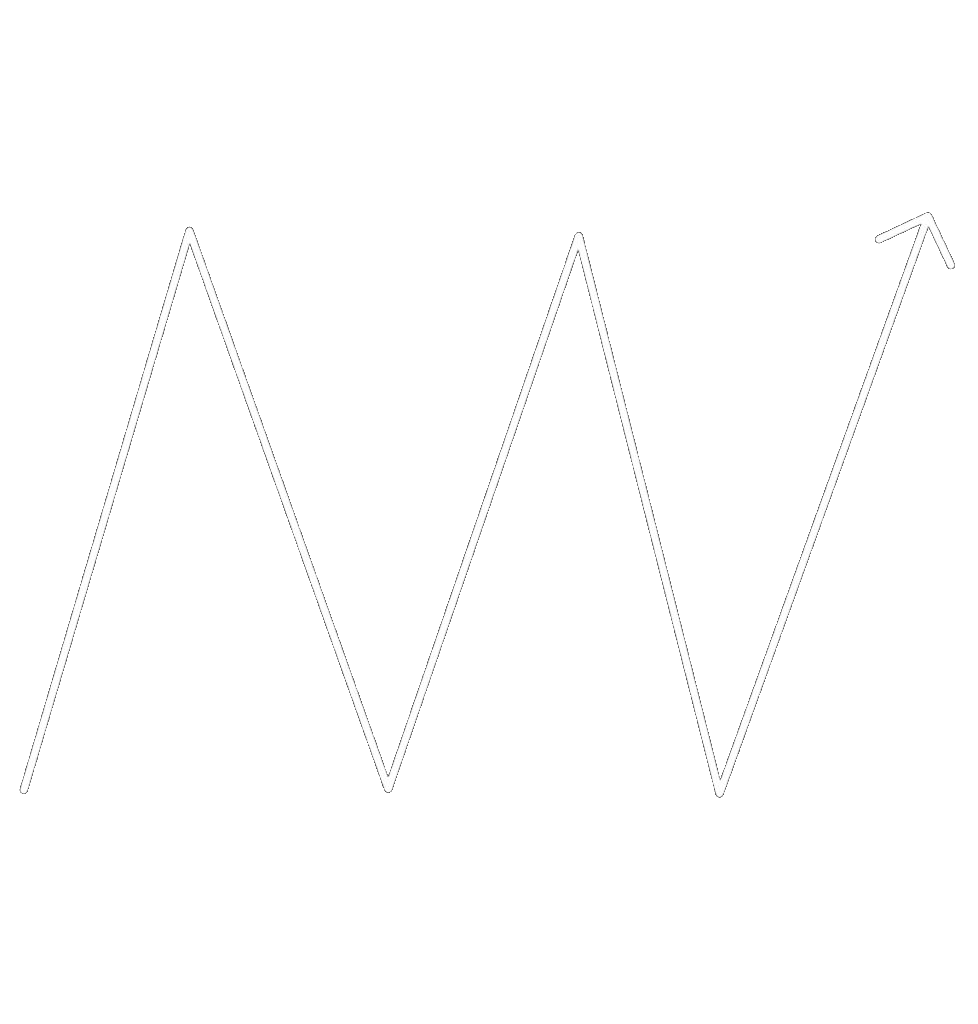
Bullish Trend Tap to learn more
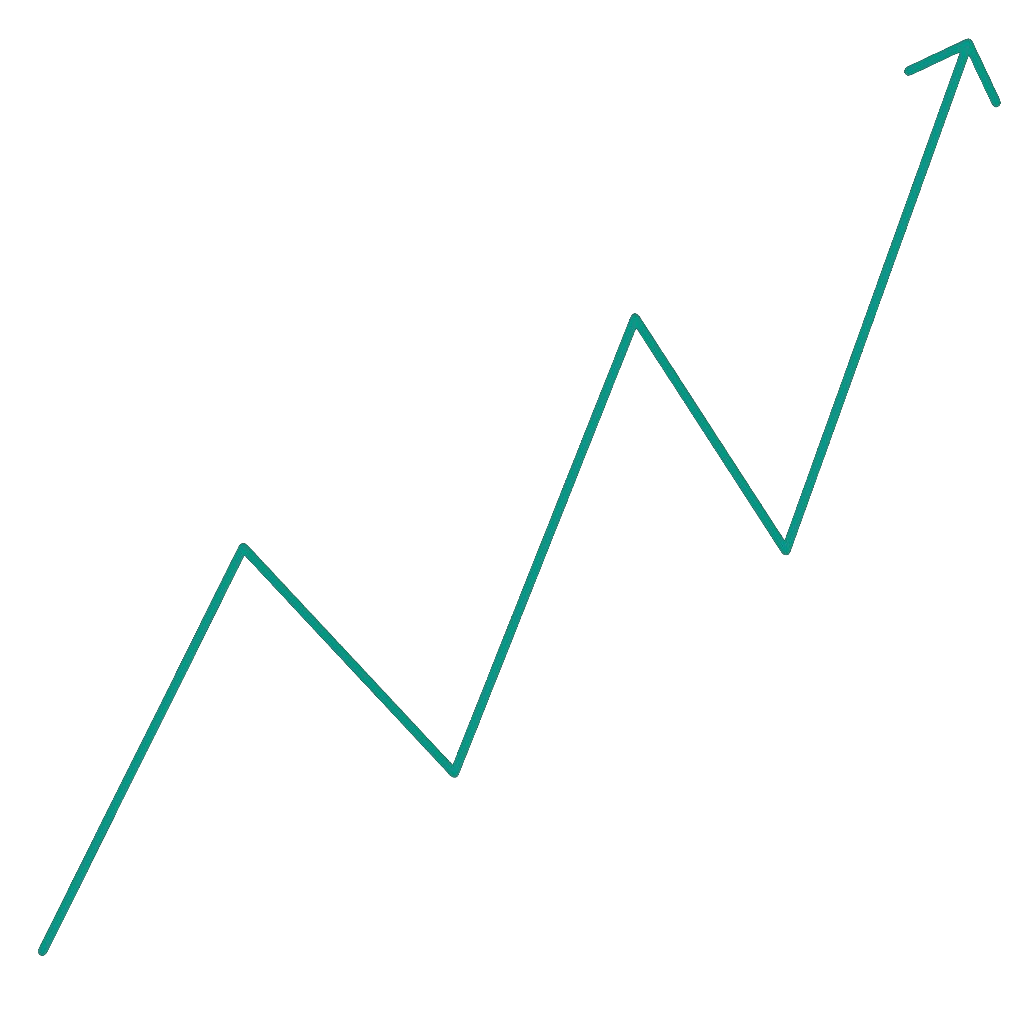
Higher Highs & Higher Lows
Price repeatedly prints Bullish BOS — breaking Structural Highs, creating new higher Structural Lows. Buyers in control. Each push phase breaks above a previous SH. Each pullback phase holds a higher low. Professionals enter on pullbacks.
Bearish Trend Tap to learn more
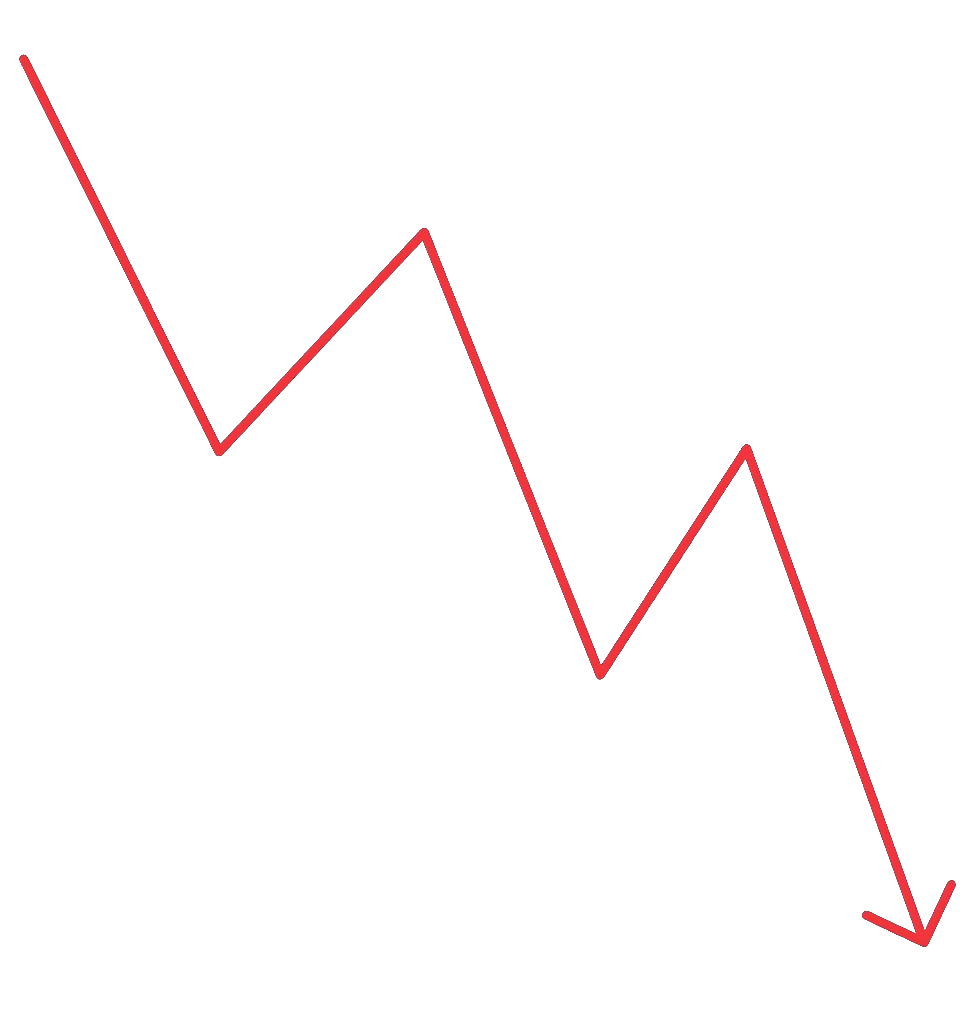
Lower Highs & Lower Lows
Price repeatedly prints Bearish BOS — breaking Structural Lows, creating new lower Structural Highs. Sellers in control. Each push phase breaks below a previous SL. Each rally (pullback) forms a lower high. Professionals enter on rallies.
Range Tap to learn more
Sideways — No BOS
No BOS. Price bounces between a ceiling (SH) and a floor (SL) without breaking either. Buyers and sellers are balanced. One side will win eventually. Your job: mark the SH and SL clearly. When the BOS comes, you'll already know exactly where it is. Professionals wait for the BOS before committing.
Market Structure
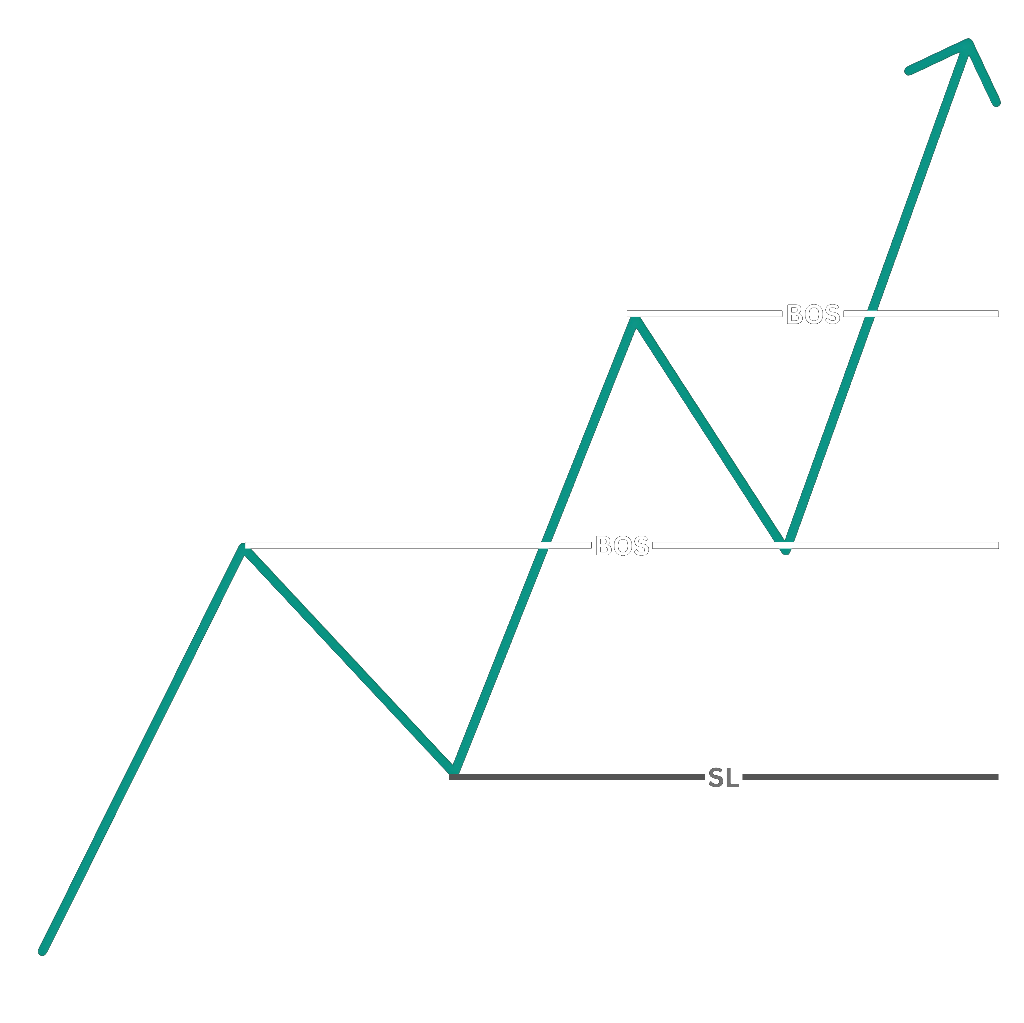
Bullish Trend — Push & Pullback
Push Phase: Price drives through a Structural High with conviction. Buyers overwhelmed sellers. Bullish BOS confirmed.
Pullback Phase: Price comes back toward the broken SH — but now it acts as support, not resistance. Buyers step back in here. They say "we want more." The trend continues.
💡 See that staircase? That's what buying pressure looks like. Buyers push. Price retreats. Buyers buy the dip. Price pushes higher. That pattern repeats. You just learned to see institutional buying in action.
Each BOS you mark is a potential support level on the next pullback. Mark the BOS level. Wait for the pullback. That's where professionals enter.
Market Structure
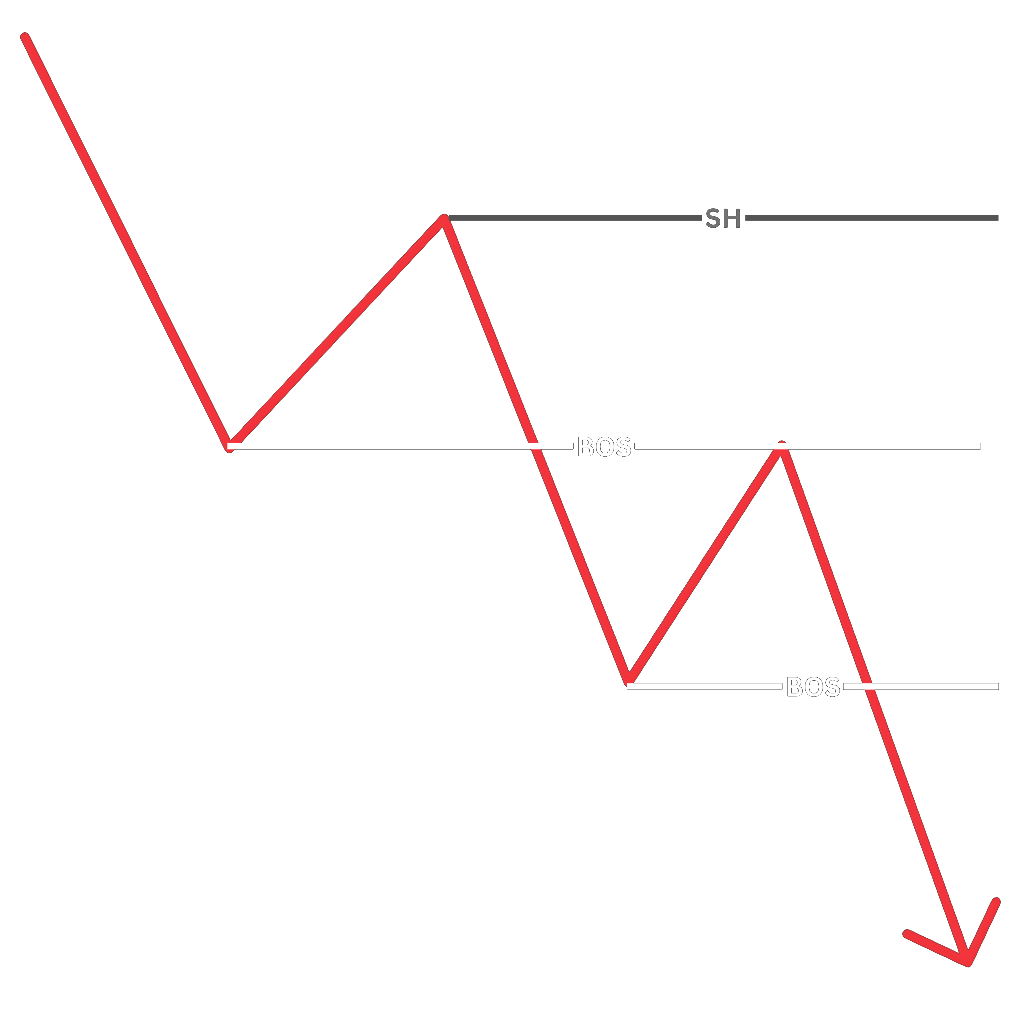
Bearish Trend — Push & Pullback
Push Phase: Price drives through a Structural Low with force. Sellers overwhelmed buyers. Bearish BOS confirmed.
Pullback Phase: Price comes back toward the broken SL — now it acts as resistance. Sellers step back in here. They want to sell more. The trend continues lower.
Each BOS you mark is a potential resistance level on the next rally. Mark the BOS level. Wait for the rally. That's where professionals enter short.
Market Structure
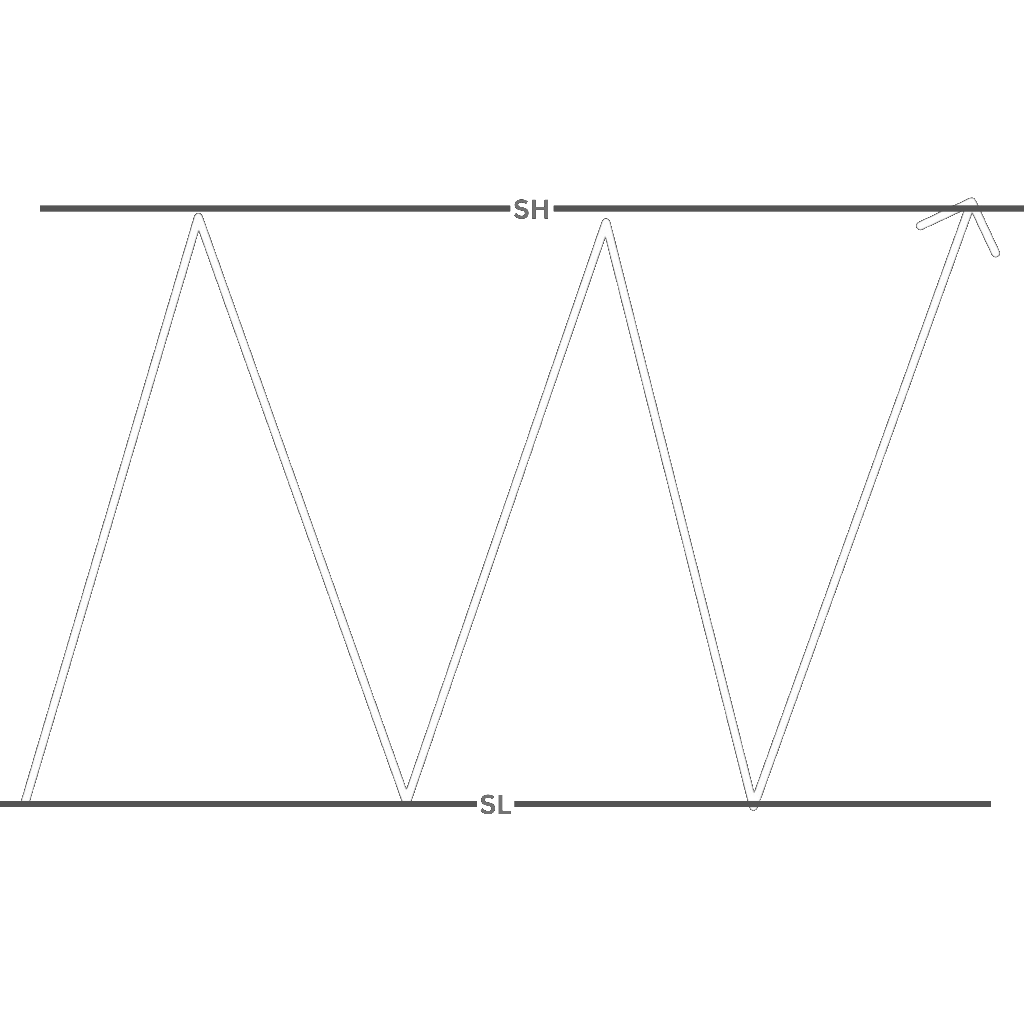
Range — Waiting for the BOS
A range forms when price tests a Structural High, gets rejected, tests a Structural Low, gets rejected — repeatedly, without breaking either level. No direction. You wait.
Your job: mark the SH and SL clearly. When the BOS finally comes — up through SH or down through SL — you'll already know exactly where it is.
No BOS = no direction. You wait. The more times price tests and respects a level, the stronger the eventual BOS will be.
Summary — The Three Market Types
Range = No BOS. Price trapped. Balanced. You wait for one side to win.
Bullish Trend = Higher highs + higher lows. Repeated Bullish BOS. Buyers in control. Professionals enter on pullbacks.
Bearish Trend = Lower highs + lower lows. Repeated Bearish BOS. Sellers in control. Professionals enter on rallies.
Why This Matters. Once you practice for a few days, you'll spot these patterns instantly. You'll see structural levels without thinking. You'll recognise a BOS before it fully closes. You'll know whether you're in a range, a bullish trend, or a bearish trend before price confirms it. That's what separates winners from gamblers.
Practice Assignment
Find All Three Market Types
On any chart: find one Range, one Bullish Trend, one Bearish Trend. Mark the structural levels and BOS candles for each. Screenshot all three. For each, write one sentence: "Why is this a range / bullish trend / bearish trend?"
Then identify: Where is the push phase? Where is the pullback phase? Where would professionals enter? You're building the pattern recognition that turns theory into instinct.
Quick Notes
Every candle = Body (Open → Close), Wick (High), Tail (Low) — three parts
Close = the most important price — determines who won and whether a level broke
Wicks and tails = rejection zones; they don't move structural levels
These levels hold because buyers and sellers remember them. They return to defend or attack the same prices, again and again.
Glossary
Up Next
Change of Structure & Trend Change
Module 4 introduces Change of Structure and Trend Change — what happens after a BOS, and how to spot reversals before most traders see them. You'll learn to read the market's intention before it moves.
Answer all 5 questions correctly to unlock Module 4. You can retake this quiz as many times as needed.
Q1 Define Structural High and Structural Low. Why do wicks beyond them not count?
Q2 What's the difference between a Bullish BOS and a Bearish BOS? Which one signals buyers are in control?
Q3 Price wicks to $105, but closes at $100. The Structural High was $102. Did a BOS occur? Why or why not?
Q4 Describe a bullish trend using structural levels and BOS. How many BOS would you expect, and what do they prove?
Q5 You identify a range, a bullish trend, and a bearish trend on a chart. Which do you trade first and why? Where would professionals enter in each? What is the risk of trading each?