You now know how to read price structure. You can identify a BOS, label a swing high and swing low, and follow a trend. You can spot when that trend ends (COS) and when a new one confirms (TC). Now comes the question every trader eventually asks: where exactly do I get in — and where do I get out?
Support and Resistance answer that question. They are your roadmap — the price levels where buyers and sellers have made their stand before, where conviction has shown up, and where price tends to react again. Knowing them means you're never guessing where price might turn. You've already planned it.
In this module you'll learn how the structural levels you've been marking evolve into Areas of Value (AOV) — the precise zones where price is most likely to react. You'll build a complete framework for planning entries and exits before a move happens, not during it. This is where the past three modules start to connect.
A broken level doesn't disappear — it flips. Support that breaks becomes resistance. Resistance that breaks becomes support. That flip is the trade. We don't predict. We react.
Support — Where Buyers Make Their Stand
Support is a price level where buyers have stepped in before, absorbing selling pressure and pushing price back up. Think of it as a floor — a level where buyers said "enough" and pushed back.
Here's what matters: every time price returns to that level, the buyers who were right before are likely to defend it again. The more times a level has held, the stronger and more reliable it becomes.
Why this matters: You're not just marking random levels. You're marking where institutional memory lives. Buyers remember where they got value. They return to defend it.
BOS Turned Support Tap to learn more
The break and the retest — the full sequence
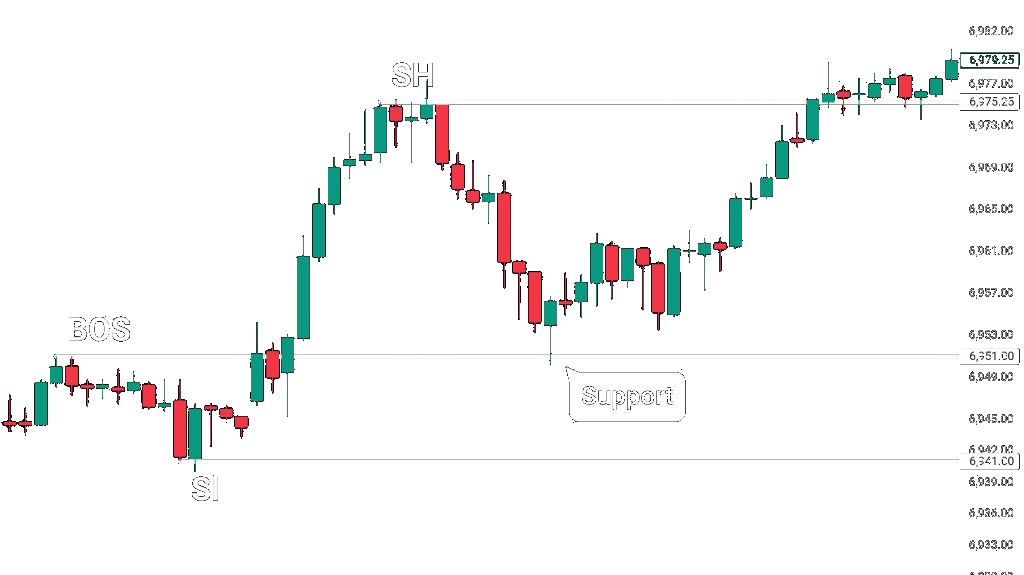
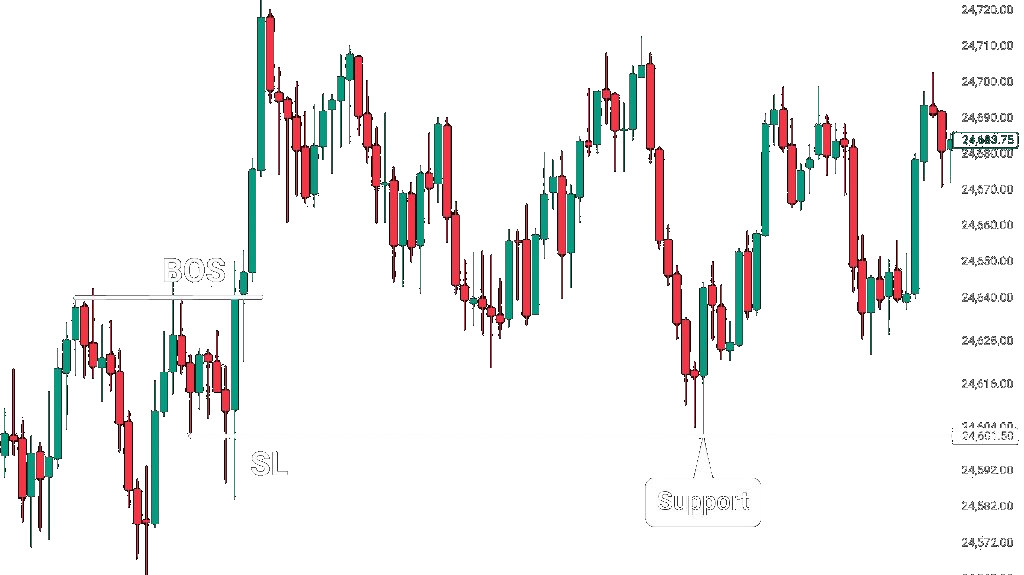
Price breaks above a Structural Low (SL) — that's the BOS. When price pulls back to retest that broken level, the SL flips into support. Mark the BOS. Wait for the retest. That's your entry zone.

Previous Structural Levels Tap to learn more
Price reacting from a known structural level
In an active uptrend, price pulls back into a previous structural level — a zone where buyers defended before. That level acts as support within the trend. The reaction from it is the trade.

This is what professional traders see that most people miss.
When retail traders look at a chart and see "price going down," a professional sees price returning to a known level — one they already have marked. They're not reacting in the moment. They set their alert weeks ago and now they're waiting. You are learning to see the chart the same way. The BOS you marked in Candles & Price Action will become the support zone you trade in Top-Down Analysis. Every concept builds. Nothing is wasted.
On any trending chart, find a level where price bounced at least twice. Draw a zone from the Swing Low to the Structural Low. Identify the Order Block inside that zone — that is your AOV. Note: are you using it as an entry zone or an exit zone? Both are valid — decide before price arrives.
Resistance — Where Sellers Make Their Stand
Resistance is a price level where sellers have stepped in before, capping upward moves and pushing price back down. Think of it as a ceiling — a level where sellers said "this is enough" and pushed back.
Here's what matters: every time price rallies toward that level, the sellers who defended it before are likely to defend it again. More tests mean stronger resistance — and a more significant reaction when price finally breaks through.
Why this matters: You're marking where selling pressure lives. Sellers remember where they made profit. They return to take profit again.

BOS Turned Resistance Tap to learn more
The break and the retest — the full sequence
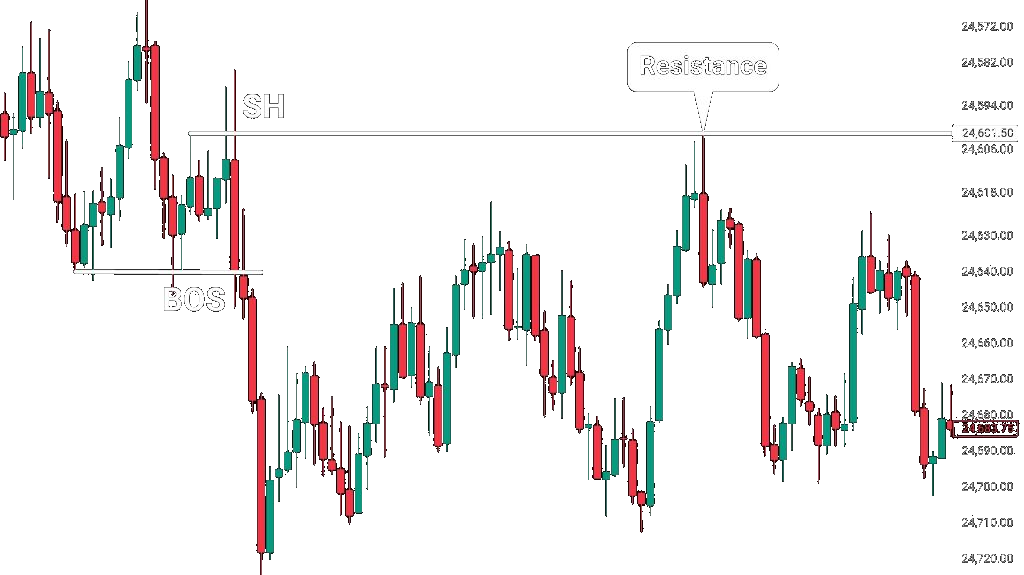
Price breaks below a Structural High (SH) — that's the BOS. When price rallies back to retest that broken level from below, the SH flips into resistance. Mark the BOS. Wait for the retest. That's your rejection zone.
Previous Structural Levels Tap to learn more
Price reacting from a known structural level
In an active downtrend, price rallies back into a previous structural level — a zone where sellers defended before. That level acts as resistance within the trend. The rejection from it is the trade.

On any trending chart, find a level where price was rejected at least twice. Draw a zone from the Structural High to the Swing High. Identify the Order Block inside — that is your AOV. Now ask: is this zone a target to exit a long, or an entry for a short? Mark your answer before price gets there.
Deep Retracements — Price Moves Through Multiple Levels
Not every pullback is shallow. Sometimes price moves through two or three structural levels while the overall trend stays intact. These levels don't disappear — they become temporary support in an uptrend and temporary resistance in a downtrend. Knowing this means you can plan your entry and exit zones before the move starts, not while it's happening.
Here's the pro move: enter with your exit already planned.
- Step 1 Identify the trend direction and mark all visible structural levels in that direction.
- Step 2 Plan your entry at the first AOV — the zone where price is most likely to react first.
- Step 3 Pre-define your take-profit (TP) zones at the next structural level in the trend direction.
- Step 4 If price moves through your first TP, the next structural level becomes the new target — already marked.
- Rule Marking levels in advance removes emotion from the decision.
In an uptrend: Price pulls back through previous support zones on its way to lower structural levels — these zones act as temporary support. Watch for a BOS at each level to see which one holds and triggers the next push phase.
In a downtrend: Price rallies through previous resistance zones — these act as temporary resistance. Watch for a BOS at each level to see which one holds and triggers the next push phase downward.
On a trending chart, identify the trend direction and mark all visible structural levels. For one pullback zone, plan an entry at the first AOV, a stop below the next structural level, and two TP zones at the next two structural levels in the trend direction. Screenshot your levels. Then watch what price does — did it hit your first TP? Your second? Did it reverse at your stop? Do this three times.
Put It All Together — The Full Picture
This is the moment everything clicks. Every module you've completed — candles, timeframes, BOS, COS, TC, and S/R zones — they don't live in separate boxes. They happen on the same chart, in the same sequence, one after another.
Once you can read all of it simultaneously, you are no longer studying trading. You are trading.
Look at what you've actually built:
- You know how to identify a trend.
- You know what a BOS looks like — and what it means when it flips a level.
- You know how to wait for a COS before looking for entries.
- You know that a TC is the market's confirmation, not a guess.
- And now you know where to place your zones so that when price arrives, you already have a plan.
The Chart Below Is a Full Story in One Image
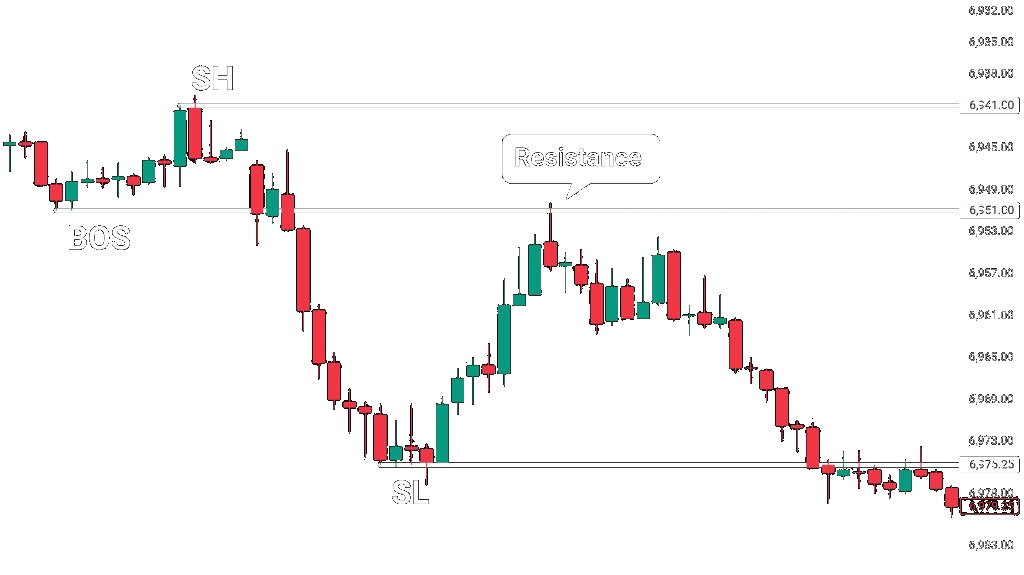
It starts bearish. Price ranges. The Structural High gets tested as resistance — multiple times, multiple rejections. Then a decisive bullish BOS closes above it. The TC is confirmed. And on the retest, that former SH — the same level sellers defended over and over — now holds as support. The flip is complete. The market just told you everything. You just had to know how to listen.
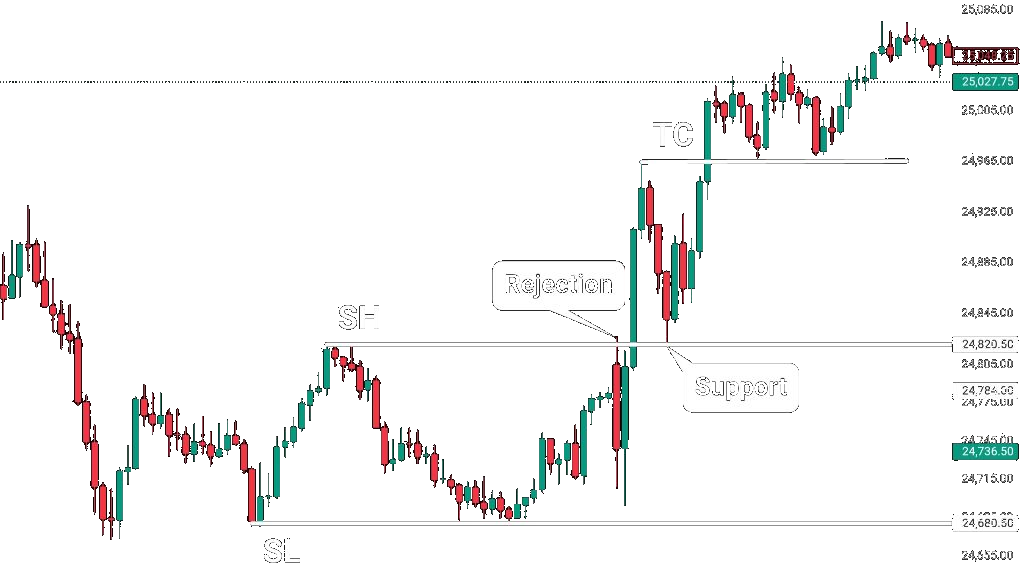
- Bearish Structure The market was in a downtrend — lower highs, lower lows. The SH and SL are marked. Sellers were in control.
- Range + Tests Price enters a range and tests the Structural High multiple times from below. Each rejection confirms it as active resistance. The level is real — and getting stronger.
- COS Signal The repeated test of the SH is the market's first sign that buyers are building momentum. This is your cue to pay attention — not act, just watch.
- Bullish BOS Price closes decisively above the SH. This is the Break of Structure — the same BOS you learned in Module 3. The bearish trend is broken. The TC is now in play.
- TC Confirmed The BOS above the SH is the first bullish break in the direction of the COS. Trend Change confirmed. This is when you start looking for entries.
- Support Flip Price pulls back to retest the old SH — and it holds. The level that was resistance for the entire bearish phase just became the support of the new bullish trend. This is the flip. Mark it. Trade it.
You just read a professional-level chart. Let that land.
Most retail traders see that chart and feel overwhelmed — or worse, they see a random series of candles going up and down with no meaning. You just read the entire story. Bearish structure. Range. Resistance tests. BOS. TC confirmation. Support flip. Every label you just applied to that chart is something 90% of traders can't do — because no one ever showed them the framework.
You have the framework now. And here's what that means in practice: you can pull up any chart, any asset, any timeframe — and within minutes you can identify where the market has been, where the key levels are, and what you're waiting for before entering a trade. That's not beginner trading. That's how professionals operate.
Modules 6 and beyond refine the precision — entry timing, risk management, trade management. But the foundation? It's right here. And you built it one module at a time. Keep going.
The market doesn't hide its levels — it repeats them. Support, resistance, BOS, TC, and the flip. Every time. On every asset. On every timeframe. Your edge isn't predicting what comes next. Your edge is already having the levels drawn when price gets there.
Pull up any asset and scroll back to find a full sequence: bearish or bullish structure → a range with multiple tests of a key level → a decisive BOS that confirms a TC → a retest of the broken level that flips it. Label every step — structure type, SH/SL, rejection count, BOS candle, TC confirmation, and the flip. Do this on three different assets. Screenshot each one. You're building the pattern recognition that turns a framework into instinct.
Quick Notes
Test your understanding. Answer all 5 questions to unlock Module 6.
1. What is a support zone built from?
2. When a bullish BOS occurs and price pulls back to retest the broken level, what does that level become?
3. What is an Area of Value (AOV)?
4. In a deep retracement, price moves through multiple structural levels. What should a prepared trader do?
5. What is confluence and why does it matter?