Every great trade starts the same way — with someone spotting that the market just changed gears before the crowd did. That's what Module 4 teaches you to see.
In Candles & Price Action you learned to read candles and identify market structure. Now we go one level deeper: what happens when that structure ends. Two signals govern that moment — and once you can read them, your whole approach to charts changes.
A Change of Structure (COS) is the first crack in the old trend — the moment the rhythm breaks. A Trend Change (TC) is the confirmation that a new trend has taken over. Together, they are your early-warning system. Miss them and you're always reacting late. Read them correctly and you're positioned before most other traders know the market moved.
A COS tells you the old trend is over. A TC tells you a new trend has started. They are separate events. Do not treat the first crack as a new trend — wait for the confirmation.
Understanding Change of Structure (COS)
Every market has a rhythm. Uptrend: higher highs, higher lows — buyers winning every round. Downtrend: lower highs, lower lows — sellers in control. Range: price bouncing between two walls. A COS is the moment that rhythm breaks. One candle closes where it shouldn't — and the whole story changes.
Up 2 Down Tap to learn more
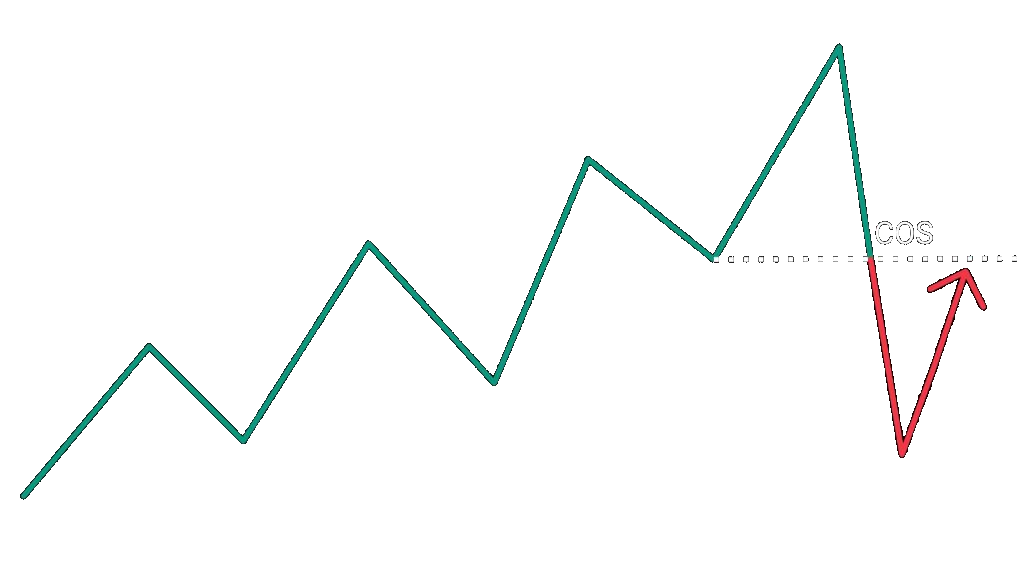
Bullish structure breaks downward
An uptrend's higher-low rhythm collapses — price closes below the previous structural low. Buyers just lost the floor.
Down 2 Up Tap to learn more
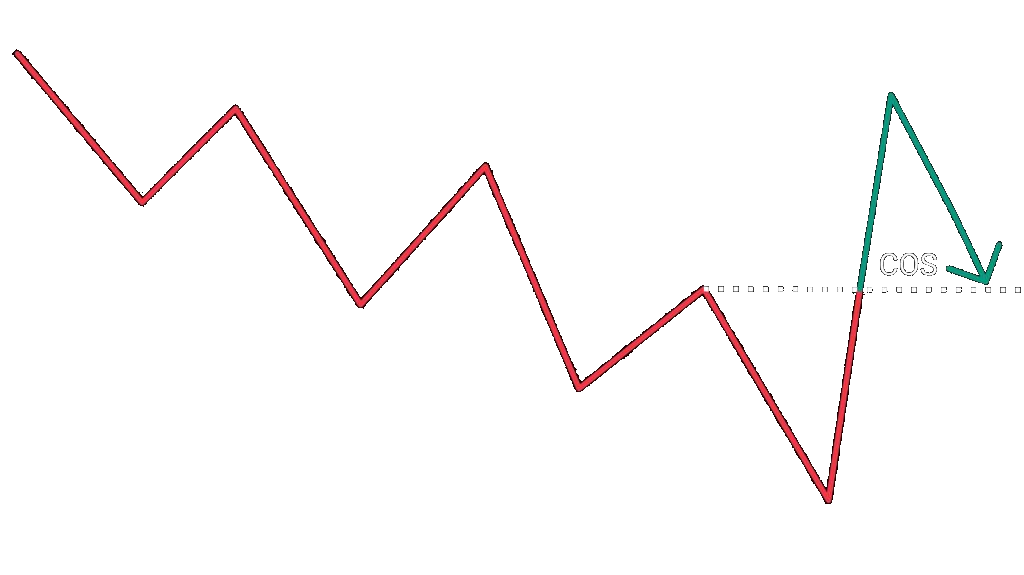
Bearish structure breaks upward
A downtrend's lower-high rhythm collapses — price closes above the previous structural high. Sellers just lost the ceiling.
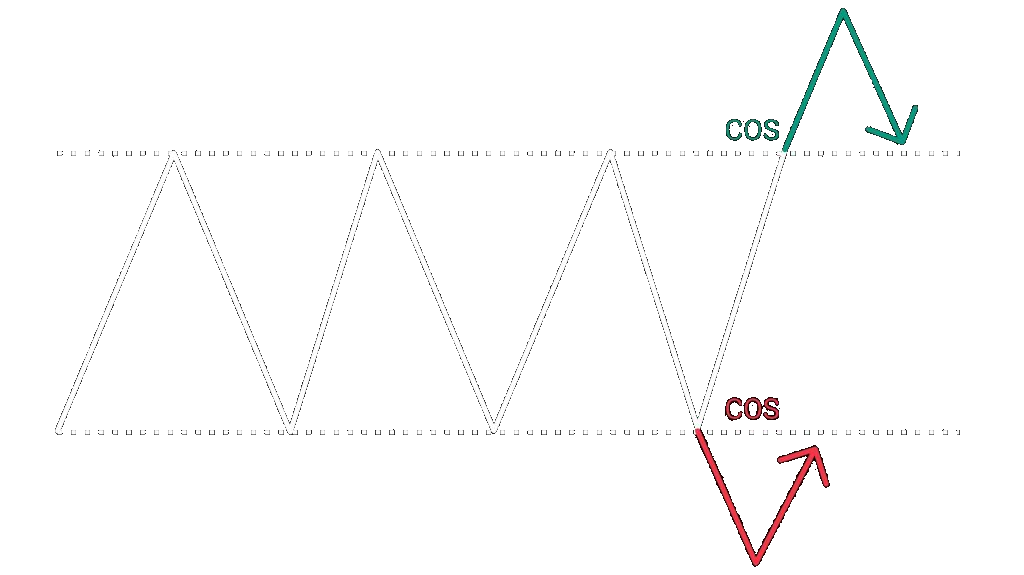
Within 2 Out Tap to learn more
Range breaks out
Price has been coiling — buyers and sellers deadlocked. Then one side closes the candle beyond the boundary. The standoff is over.
- COS When you see a COS: pause. The old trend is dead. But the new one hasn't been born yet. Mark the level. Do not trade.
- Close A COS is only confirmed by a candle closing beyond the structural level. A wick that pokes through and pulls back? That's a test — not a break. Wicks are noise. Closes are truth.
Pull up any chart. Find one Up 2 Down, one Down 2 Up, one Within 2 Out. For each: mark the structural level that broke and confirm the break was a close — not a wick. You're training your eye to see the exact moment a trend ends. Do this until you can spot them without thinking.
The Trap Most Traders Fall Into
Here's what happens to retail traders, again and again. A COS prints — price closes beyond the level, looks convincing — they jump in. Then price whips straight back and they're stopped out. What they just experienced wasn't a real COS. It was a liquidity grab. Institutions swept the stop-losses sitting just beyond the level, filled their orders, and reversed. The trap was set and they walked right into it.
- Real COS Price closes beyond the structural level — then continues. Structure commits to the new direction. Mark it. Wait for what builds next.
- False Break Price closes beyond the level — then snaps back inside. A liquidity grab. The original trend is still alive. Do not trade it.
Go back to your 3 COS examples. For each: did price stay committed after the break — or did it snap back? Label each one "Real COS" or "False Break." If it was a false break, mark where the liquidity grab happened. Both outcomes teach you something. Build the habit of asking this question on every COS you identify.
Trend Change (TC) — This Is When You Act
COS is the pause — the old trend just died. TC is the confirmation — the new trend just proved itself. Here's the key: you don't act on the COS. You act on the TC. The TC is the market showing you, with real price action, that the new direction is committed. Before that happens, you're guessing. After it happens, you're trading with structure behind you.
COS = old trend is over. BOS in the COS direction = new trend confirmed. That sequence — and only that sequence — is your entry signal. Wait for the BOS. That's the TC. That's when you act.
Bearish TC Tap to learn more
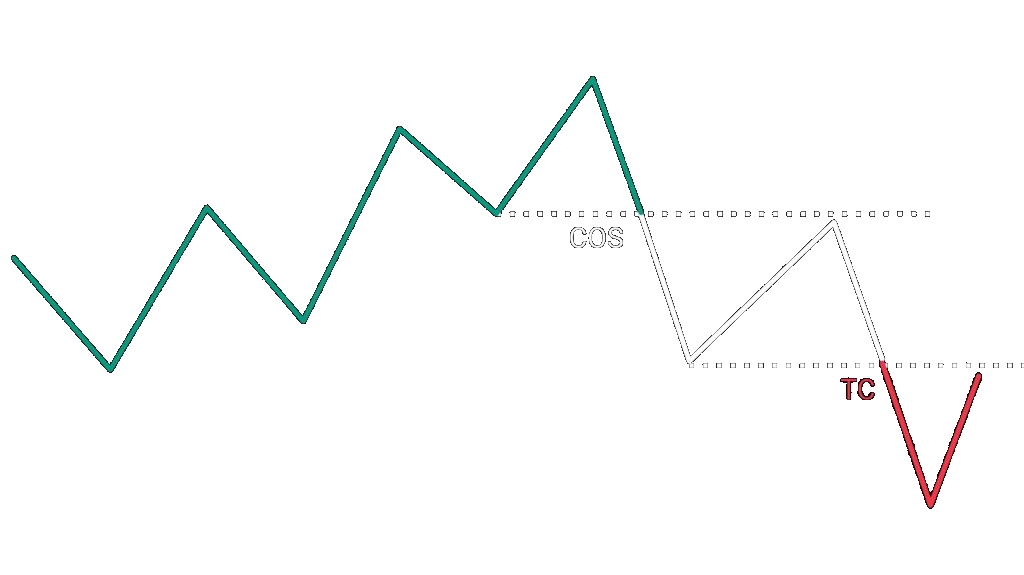
After a bullish COS — new bearish trend confirmed
Uptrend breaks down (COS) → price rallies but makes a lower high → price drops to a new lower low. That lower low is the first BOS down — and your TC.
Bullish TC Tap to learn more
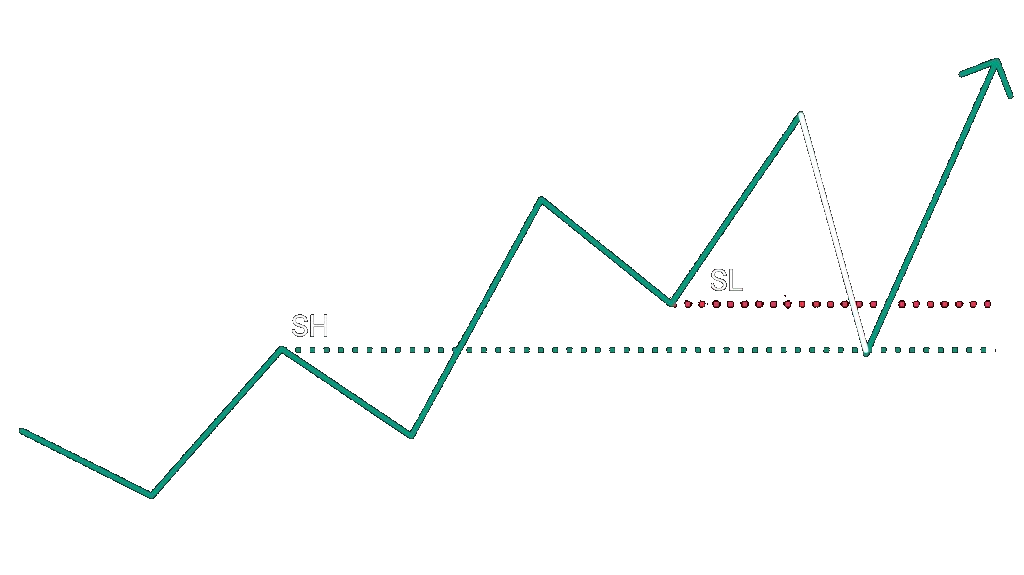
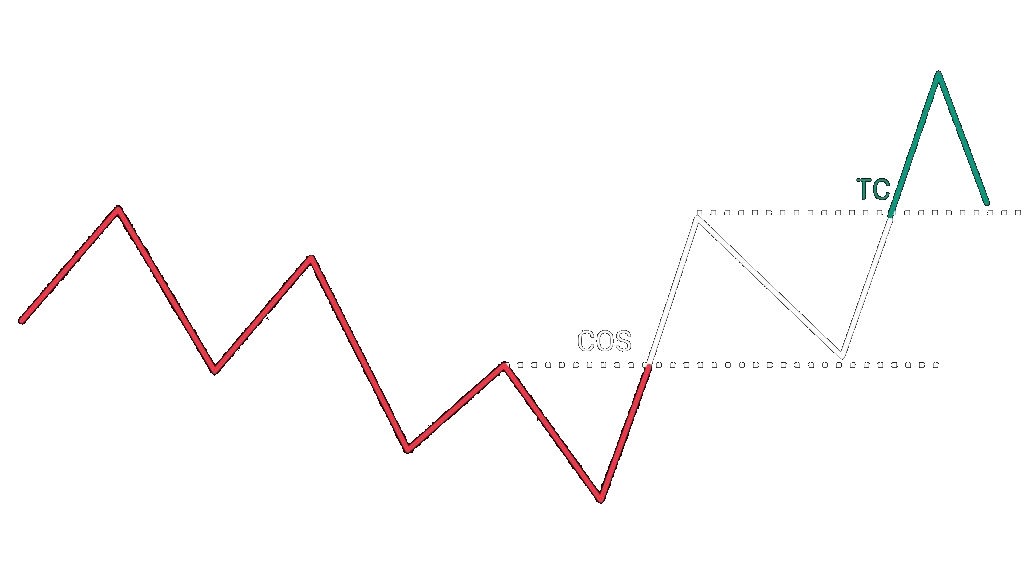
After a bearish COS — new bullish trend confirmed
Downtrend breaks up (COS) → price pulls back but holds a higher low → price pushes to a new higher high. That higher high is the first BOS up — and your TC.
The COS shows you the door. The TC tells you it's safe to walk through.
- COS = Pause The old trend is dead. Do not trade. Mark the level, mark the next swing point that forms, and wait. Your job right now is to observe.
- TC = Play The first BOS in the direction of the COS confirms the new trend. That is your entry trigger. Not before — now.
Return to your 3 COS examples. For each real COS: did a TC happen? Can you see the three-step sequence — COS → intermediate swing point → first BOS? Mark the TC if it appeared. If no TC formed, note what happened instead. You learn from both outcomes. Walk through this sequence until you can read it naturally on any chart.
COS + TC Gives You Direction. Module 5 Gives You the Level.
You now know when the market is changing. That's half the skill. The other half is knowing where to enter once it has changed. That's what Module 5 is for.
- Module 3 Read market structure — Range, Bullish Trend, Bearish Trend. Understand the Push and Pullback phases that build every move.
- Module 4 Spot when that structure ends (COS). Wait for the new direction to prove itself (TC — first BOS in the COS direction). Now you know which way to trade.
- Module 5 Find the exact price level — the Support or Resistance zone — where professionals will enter after the TC. That's your entry zone.
Quick Notes
- Change of Structure (COS)
- The moment a market's structural rhythm breaks. Uptrend: a close below a structural low. Downtrend: a close above a structural high. Range: a close beyond either boundary. COS = pause — not a trade signal.
- Trend Change (TC)
- The confirmation that a new trend has started. Defined as the first BOS in the direction of the COS. COS = pause. TC = play. Do not trade until the TC is confirmed.
- Up 2 Down
- Bullish COS — price closes below a structural low in an uptrend. The higher-low rhythm is broken. Signals a possible move downward. Wait for bearish TC to confirm.
- Down 2 Up
- Bearish COS — price closes above a structural high in a downtrend. The lower-high rhythm is broken. Signals a possible move upward. Wait for bullish TC to confirm.
- Within 2 Out
- Range COS — price closes beyond either boundary of a consolidation zone. One side of the standoff just broke through. Wait to see if it holds or snaps back.
- False Break
- Price closes beyond a structural level then immediately reverses back inside. A liquidity grab engineered by institutions. Not a genuine COS — the original trend is still alive.
- Liquidity Grab
- A deliberate move to trigger stop-losses sitting just beyond structural levels, allowing institutions to fill large orders before reversing price. Causes false breaks and stop-outs for retail traders.
- Lower High / Higher Low
- The intermediate swing point that forms between a COS and its TC. Lower High (after bearish COS) = sellers are still winning pullbacks. Higher Low (after bullish COS) = buyers are defending the new territory. Both are TC setup signals — not entries themselves.
Five questions. Answer them all correctly to unlock Module 5 and the Support & Resistance entry zones.
1. What does COS stand for — and what does it tell you when you see one?
2. You're watching an uptrend. Price dips below the previous structural low — but the candle closes back above it. Is this a COS?
3. Price is in a downtrend. A candle closes above the previous structural high (COS — Down 2 Up). Price then pulls back and forms a higher low. What's the correct next step?
4. A candle closes below a structural low (COS). Then the very next candle closes back above it — fully inside the previous range. What just happened?
5. What is the complete COS → TC sequence that signals a new bullish trend?